Climate Change in Australia
Climate information, projections, tools and data
Current warming level
How far towards the global warming levels are we?
We are approaching 1.5 °C warming above pre-industrial temperatures and anticipate moving beyond this level of warming in the next 10 years. We can now only achieve 1.5 °C by overshooting and then returning to it.
Reaching a global warming level means the climatological global surface air temperature (GSAT), averaged over land and ocean, is at or near that level relative to the baseline (reference period) chosen to represent the pre-industrial climate: 1850–1900 for a sustained period. There is now broad agreement that a 10-year or even 20-year average should be used.
Before then, the temperature of a month or a year will reach the warming level temporarily. We have now seen months and even a calendar year at 1.5 °C (2024), but we are not at the sustained warming level yet.
If we use a 20-year average, we can only confirm that a warming level has been reached, and exactly when it was reached, 10 years after the year it was exceeded. In the meantime, we can estimate the current global warming level using three main approaches (see WMO 2025)
- The recent 10 years of observations plus model simulations of the next 10 years
- Fitting a trend to the data and take the current date in the trend
- Estimate the warming from human caused drivers
All methods give similar results – estimates for 2024 are 1.34 to 1.41 °C (see WMO 2025)
Our path towards the various global warming levels can be visualised in a graph of global temperature relative to the 1850–1900 baseline. Climate researchers usually compare five or more different datasets of global average temperature, but for simplicity just the Berkeley Earth Surface Temperature dataset is used here (Rohde and Hausfather 2020). The estimated uncertainty in global temperature in this dataset in the 1850–1900 period is added as an uncertainty band through the whole graph, as an indication of the uncertainty in progress towards each level.
Use this Visualiser to see the latest Global Warming Level estimate using a fit of recent trends (credit: Copernicus)
The following dropdowns show how global average temperature is tracking on various timescales.
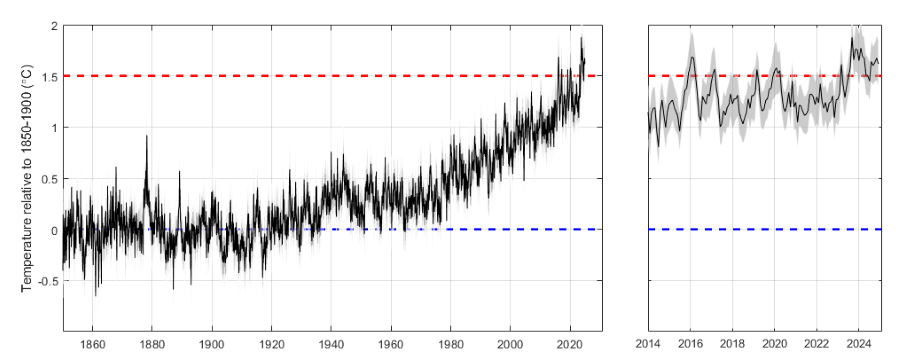
Monthly
Global temperatures have already experienced numerous months at 1.5 °C or more
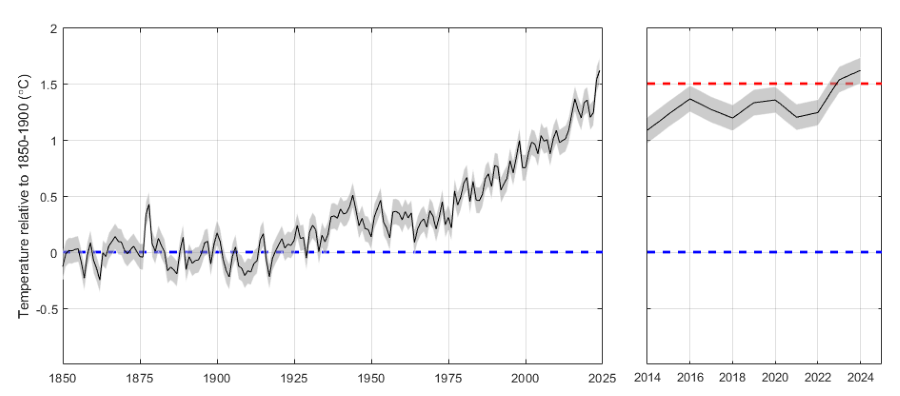
Annual
We have had a calendar year of 2024 at 1.5 °C. 2023 was close to 1.5 °C
5-year average
The 5-year running mean is approaching 1.5 °C
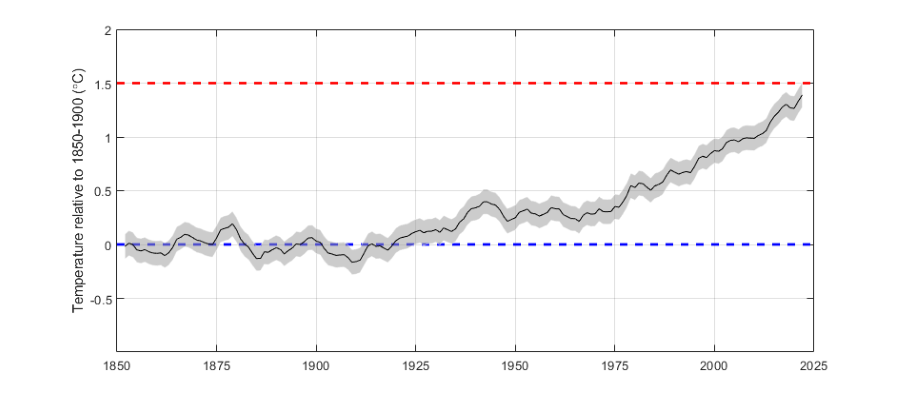
10-year average
The 10-year running average is clearly above 1 °C and approaching 1.5 °C

Page last updated 1st Dec 2025