Climate Change in Australia
Climate information, projections, tools and data
Case Study: Soil moisture & infrastructure
- Why Was This Case Study Chosen?
- How Did the Case Study Use Climate Data?
- What Did We Find?
- What Similar Problems Could This be Applied to?
- References
- Downloads
Why was this case study chosen?
Changes in the water content of the upper several metres of soil ('soil moisture') with climate change may have an impact on energy system infrastructure. Two potential impacts are explored here:
- The ability of soil around towers to 'ground' or 'earth' lightning strikes, providing a safe route for current and reducing the probability of damaging arcing between conductors
- The ability of soil around underground cables to conduct heat away from the cable, allowing it to maintain a safe operating temperature
For both of these applications, reduced soil moisture may reduce the result in reduced safety or reliability.
How did the case study use climate data?
Ausgrid and AEMO representatives indicated that soil moisture in the first metre or so is of most relevance for both climate-sensitive applications identified. From a hydrological perspective this is termed ‘root-zone soil moisture’ and is defined as sm = s0+ss (where s0 is the soil moisture in the surface layer: 1–10 cm, and ss is the soil moisture in the shallow layer: 10–100 cm).
Historical soil moisture observations were obtained from the Australian Water Outlook. Figure 1 shows the deep soil moisture extreme values observed across Australia once a year, once every five years and the more rare, wetter periods that occur once a decade.1
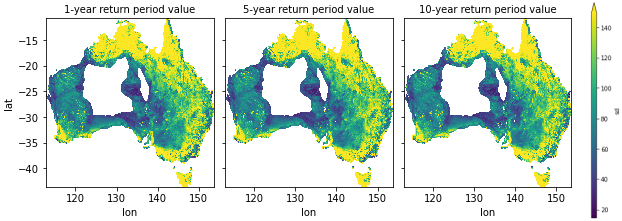
Figure 1. Spatial maps of soil moisture (mm) ARI (based on the 1976 to 2005 averaged period)2 for the deep soil (1 m to 5 m) from the Australian Water Resource Assessment (AWRA) model driven by AWAP observations.
Hydrological projections3 provide soil moisture changes based on a combination of four global climate models and three different downscaling methods for two different emissions pathways RCP4.5 and RCP8.5.
The project has produced daily outputs scaled to 5 km spatial resolution with aggregated change signal for four time slices:
- 2030 (2016–2045)
- 2050 (2036–2065)
- 2070 (2056–2085)
- 2085 (2070–2099)
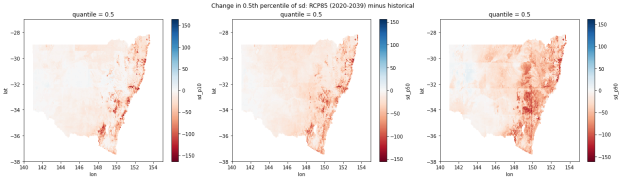
Figure 2. Long-term changes in the absolute value of soil moisture (mm) in the deep soil layer (1 m to 5 m) for NSW from an ensemble of climate models. This figure shows the change in median soil moisture under the RPC8.5 scenario for the 30 years centered on 2030. The left shows the 10th percentile of the ensemble (driest scenario), the center figure shows the 50th percentile (mean scenario) and the right shows the 90th percentile (wettest scenario).
What Did We Find?
Soil moisture is projected to decline across much of eastern NSW, although there is very high variability between sites and interannual variability is much more significant than the trend (Figure 3). Across northern Australia, there seems to be a wetter trend related to increased rainfall for the region under current climate projections. Across inland and southern parts of the country, there seems to be a slight tendency towards a drying scenario. It is notable that there is no significant difference between projections for RCP4.5 and RCP8.5.
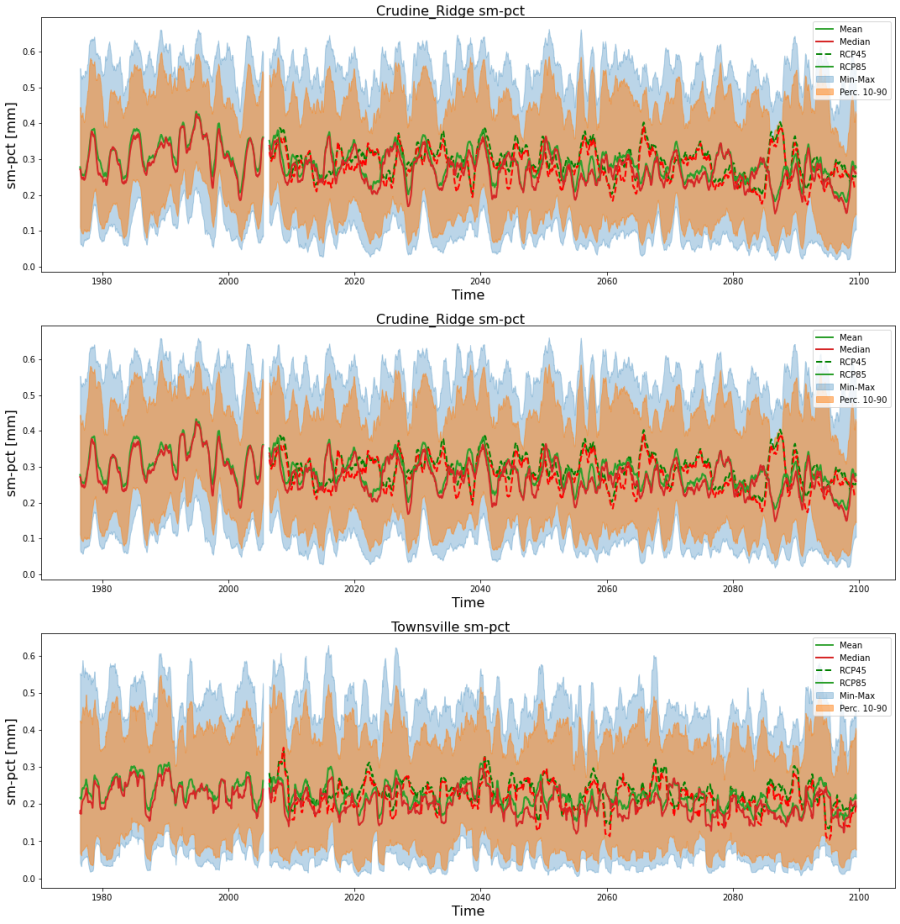
Figure 3. Time-series of the deep (1 m to 5 m) soil moisture content at (a) Sydney (top) and (b) Crudine Ridge (middle) in the eastern central tablelands and Townsville (bottom) showing the historical values (left) and projections (right). This analysis shows both RCP4.5 and RCP8.5 and uses ensemble model output for extreme and quantile range.
What similar problems could this be applied to?
The climate data has been produced for absolute soil moisture content, rather than relative soil moisture content (percentage saturation) which depends on soil type. Historical data for local soil moisture content can be compared with the absolute soil moisture trends to derive a scale-factor to apply to climate projections (known as 'bias correction').
However, the climate projections suggest that long-term trends are insignificant compared with inter-annual variability across most of the national electricity market. This means the long-term climate change is not likely to present a significant increased (or decreased) risk to either thermal buffering of underground power lines, or to the ability of current grounding systems to protect against lightning strikes relative to current risk.
References
Vargas Zeppetello LR, Battisti DS, and Baker MB (2019). ‘The origin of soil moisture evaporation regimes’ Journal of Climate 32:2. 10.1175/JCLI-D-19-0209.1
Notes
1 See ESCI Key Concepts —Deriving average recurrence interval maps.
2 Although the 1986–2005 period is used as standard for ESCI data sets as the standard reference historical baseline (consistent with Climate Change in Australia), the National Hydrological Project uses a climate baseline of 1976–2005.
3 See ESCI Key Concepts —National Hydrological Projections.
Downloads
DownloadAll figures (zip 846.0 KB)