Climate Change in Australia
Climate information, projections, tools and data
IMPORTANT CONSIDERATIONS WHEN USING CLIMATE PROJECTIONS
When using climate data there are a number of important considerations to take into account to ensure that the climate data selected represents an appropriate range of possible future climates, is fit for purpose, contains the information you require and is robust.
Users of climate projections are strongly advised to represent a range of climate model results in their studies and reports. Read more about using climate projections .
Choosing models
Climate projections produced on this website are derived from up to 40 CMIP5 models . The range of results from these models indicates our current understanding of plausible projections for a given region, emission scenario and future time period. While preferable, it is not always practical to conduct assessments using the results from all available climate models. Therefore, when conducting risk assessments it is recommended to carefully select models that represent a range of future scenarios.
When conducting an impact assessment where more than one climate variable is relevant, it is inappropriate to use a temperature projection and a rainfall projection, for example, from two different model sources. Only values obtained from a single model have internal consistency and are considered physically plausible.
CSIRO’s Climate Futures approach have been developed to simplify communication and use of climate projections and to help capture the range of projection results relevant to a specified region. This enables a large amount of climate model output (for a particular time period and emissions scenario) to be summarised by grouping it into a small number of categories, each of which is defined by a range of change in two climate variables such as temperature and rainfall. It is supported by the Australian Climate Futures web tool . This tool can assist users to choose models relevant for their assessments.
Choosing emissions scenarios
The future of anthropogenic greenhouse gas and aerosol emissions (and hence their resultant radiative forcing) is highly uncertain, encompassing substantial unknowns in population and economic growth, technological developments and transfer, and political and social changes. The climate modelling community has responded by the development of Representative Concentration Pathways (RCPs) to explore credible future options.

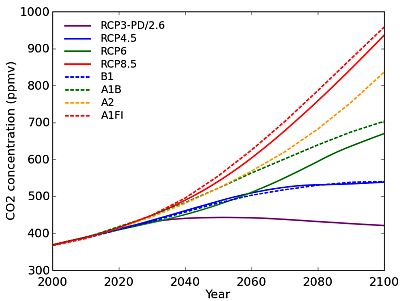
Comparison of RCPs and SRES CO2 concentrations. Note that these are not CO2 equivalent concentrations. SOURCE: Data from Potsdam Institute
The four RCPs associated with the CMIP5 modelling experiment were developed by a group of experts in areas spanning atmospheric modelling, chemistry and the carbon cycle and social scientists working in economics, policy and impacts (TR3.2). They are named RCP2.6, RCP4.5, RCP6.0, and RCP8.5 in accordance with the corresponding range of radiative forcing values (in W/m2). Radiative forcing is a measure of the level of influence these gases have on the Earth’s energy balance. RCPs differ from the Special Report on Emission Scenarios (SRES) scenarios used in the 2007 report on Climate Change in Australia and in the IPCC Fourth Assessment Report. A comparison of carbon dioxide concentrations for the two sets of scenarios is shown where the intermediate scenario RCP4.5 could be considered as a trajectory with moderate mitigation, consistent with the B1 scenario of the SRES scenarios developed in 2001. The highest RCP scenario, RCP8.5, is similar to the A1FI, or highest concentration case in the SRES scenarios.
For near-term projections (early in the century), it is less important to represent the range of emissions scenarios in risk assessments as at this point in time the forcing of the different scenarios does not diverge significantly.
For risk assessments relevant for planning for later in the century the choice of emission scenario, and the consequent forcing of the climate system, can have a large influence on the potential results.
Representing the range of emissions scenarios in a risk assessment can indicate the sensitivity of a system to international emissions policies.

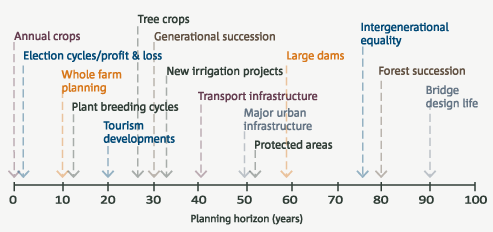
Typical planning horizon (years) from different sectors. SOURCE: Jones and McInnes 2004
Choosing time periods
For many planning scenarios, decisions made today will have consequences for many decades in future with regard to regional planning, land use, infrastructure investments, etc. The planning horizon will vary for different sectors. For example, when planning forest plantings for bio-sequestration of carbon emissions, the trees will be exposed to the climate in 2030 and beyond, so it is important to consider climate change projections that are relevant late into the century. However for planning new irrigation projects, a less distant focus in time is more appropriate.
Note that contributions to magnitude of ranges of model output, e.g. the range of temperature change, will be dependent on the time period of interest. Projections further into the century will be strongly influenced by the emissions pathway taken to this time, where early in the century the emissions path has less influence on the range (See Technical Report Section 6.1).
Page updated 20th December 2020


