Climate Change in Australia
Climate information, projections, tools and data
Case Study: The impact of climate change on transmission line ratings
DownloadFull Case Study
(pdf 956.7 KB)
- Why Was This Case Study Chosen?
- How Did the Case Study Use Climate Data?
- What Did We Find?
- What Similar Problems Could This be Applied to?
- Downloads
The ESCI project provides tools, tailored to the electricity sector, that can be used to assess the risk that climate change may present to future reliability, resilience and operations.
Why was this case study chosen?
High voltage electricity transmission networks connect generators, distributors and major end users. Transmission line ratings define the maximum power that can be safely carried by a line, essential to avoid damage from overheating and to limit sagging beyond minimum clearance levels. For NSW and ACT, line ratings assume maximum power transfer and co-incident high temperature and low wind speed, derived from historical weather data.
Transmission lines can heat up when they carry electrical current, when the ambient temperature rises, and from direct solar radiation. As a line heats up, the amount of electrical current it can safely carry is reduced, lowering the line rating. Lower line ratings across the network can reduce supply on very hot days. It is also on these hot days that community electricity demand tends to increase, so the combined impact could reduce the reliability of energy supply.
How did the case study use climate data?
The case study followed the steps of the ESCI Climate Risk Assessment Framework. Historical and projected daily maximum temperature data were analysed to 2080, for 15 locations across TransGrid’s transmission network. To account for the plausible range of future projections, the case study used data from up to four global climate model simulated under three different emissions pathways (low, RCP2.6; mid, RCP4.5; and high, RCP8.5).
Historic and projected temperature information drawn from these models was used to drive the existing ‘temperature-rating’ model used by TransGrid to assess how future temperature increases may affect electricity transmission line ratings across the network.
What Did We Find?
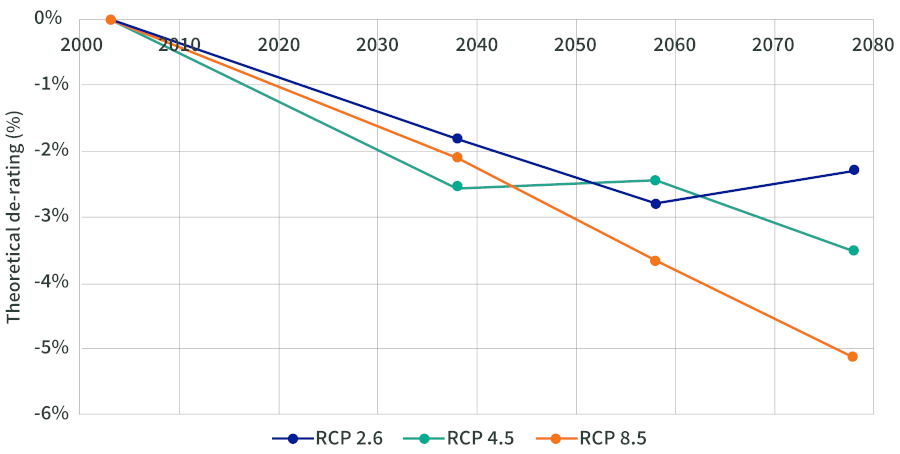
Unsurprisingly, the results show that the higher the projected warming, the higher the theoretical transmission line de-rating. From an analysis representing 84% of TransGrid’s transmission assets, projected warming could reduce the theoretical ‘maximum summer day normal’1 rating of their network by between 2.3% (RCP2.6) and 5.1% (RCP8.5) on average by 2078, against a 2003 baseline.

Figure 1. Reduction in theoretical rating of TransGrid’s network (based on an 84% coverage of the network, weighted by line length); De-rating calculated using average value from respective maximum consensus model output.
These effects on ratings can potentially be managed through use of dynamic line rating, periodic re-rating of existing transmission lines and by considering the specifications when designing new lines.
What similar problems could this be applied to?
Rising temperatures have an impact on most of the infrastructure of the National Electricity Market. They reduce the ability of generators (both conventional and renewable) to supply power, and, as this case study has shown, can reduce the ability of transmission and distribution lines to carry power on very hot days. Notably, these hot days are also associated with rising demand for electricity, particularly during heatwaves when people turn on air conditioners to gain some respite from hot weather.
There is high confidence that temperatures are projected to rise in Australia under all future climate scenarios. Maps describing future temperature scenarios and how these vary regionally, according to a range of climate models can be found on the ESCI Climate Data portal. The rate of projected temperature increase using projected temperature time series, can be explored sector to assess asset risk. These are available, for 168 locations of interest to the electricity sector, on the ESCI portal.
The ESCI User Guidance explains how to conduct your own risk assessment.
For more detail on this assessment please see the full Case Study report (pdf 957 kB) .

Notes
1 Defined as the 15th hottest day in the previous 15 years.
Downloads
DownloadFull case study report and all figures (zip 791.4 KB)


