Climate Change in Australia
Climate information, projections, tools and data
Emergence
Has Australian annual temperature ‘emerged’ from the pre-industrial climate?
Emergence relates to whether the ‘signal’ of climate change has completely emerged from the ‘noise’ of climate variability. When each year is above the range expected in the reference baseline period, then the climate is said to have ‘emerged’ from that earlier climate (Hawkins et al. 2020). Related ideas are the first year when the signal-to-noise ratio crosses a threshold of one, which is the ‘time of emergence’ from the previous era (Hawkins and Sutton 2012), and the last year within two standard deviations of the noise.
The idea of emergence can be useful when considering the long term climate variability experienced in a particular place – if the climate is normally highly variable, it will be more difficult to clearly identify a warming trend until this trend is large.
We estimate the signal and noise through regression onto global mean surface temperature (methods of Hawkins et al. 2020).
The annual temperature of Australia and most states and territories has now 'emerged' from the baseline (reference period) chosen to represent the pre-industrial climate of 1850-1900.
Download Global Warming Levels Technical note 2 for details (right click to open in a new window).
Australian temperature without global warming
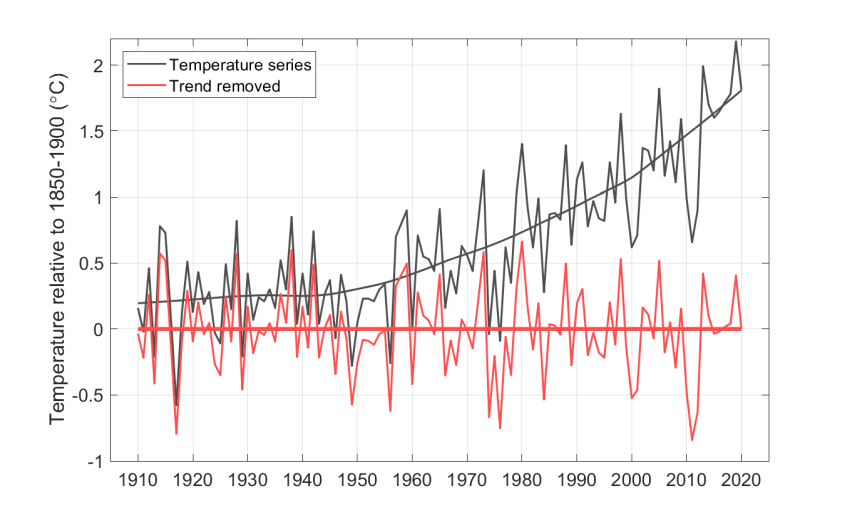
If the long-term trend in the average annual temperature for Australia is removed (41-year Lowess smoother):
Or, if we remove the global warming 'signal' from the series (see Technical note 2 for details):
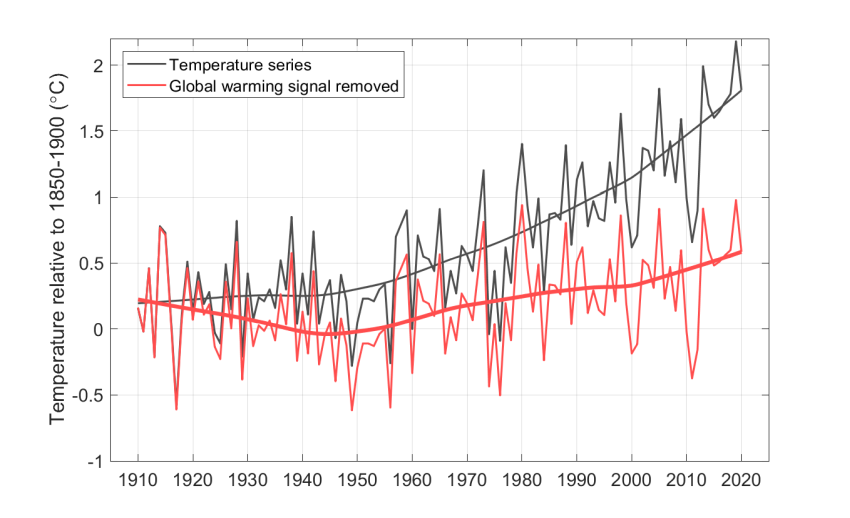
In both these cases, we see a temperature series with little trend. In either hypothetical world, 2019 appears as a warm year, but within 1 °C of the pre-industrial climate, rather than >2 °C.
Emergence - Australia, states and territories
Australia
If we don’t remove the signal, we see the average annual temperature has almost certainly emerged from the 1850–1900 climate. The range of two standard deviations around the smoothed data series separated from the natural climate variability ‘noise’ of the pre-industrial annual temperature in the year 2007. As a very cool outlier year due to a La Niña event, the temperature of 2011 lay within two standard deviations of the pre-industrial climate.
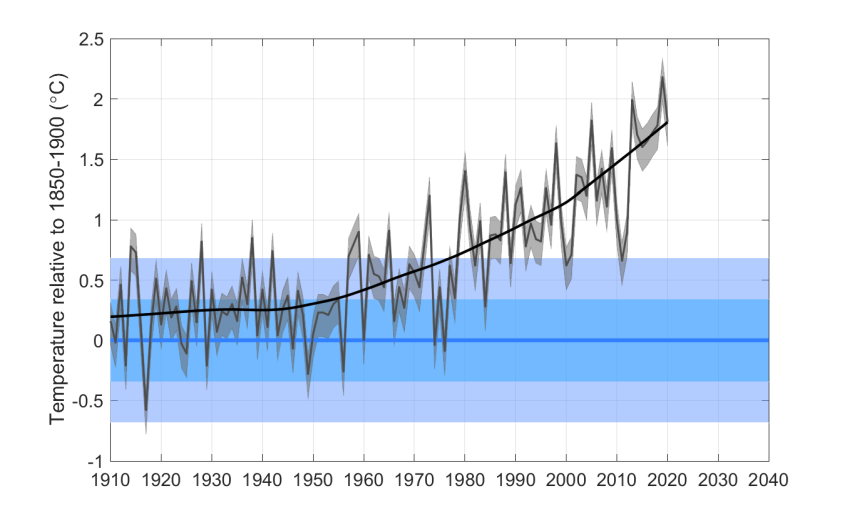
Due to greater variability at the regional scale (lower 'signal to noise') and lower warming in some regions, the temperature of not all states and territories and NRM Super-Clusters has 'emerged' from the 1850-1900 level
New South Wales and Australian Capital Territory
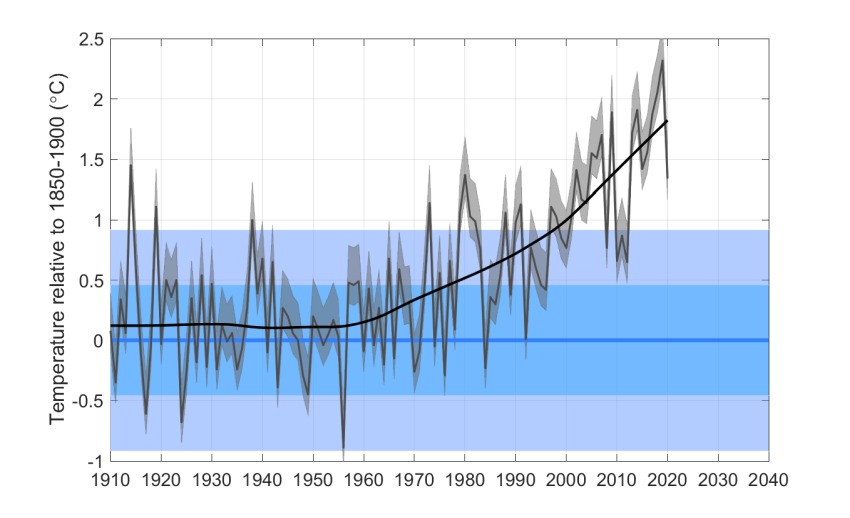
Two standard deviation range separated from pre-industrial range: not yet
Last year possibly within 2 standard deviations of 1850-1900 climate: 2012
Northern Territory
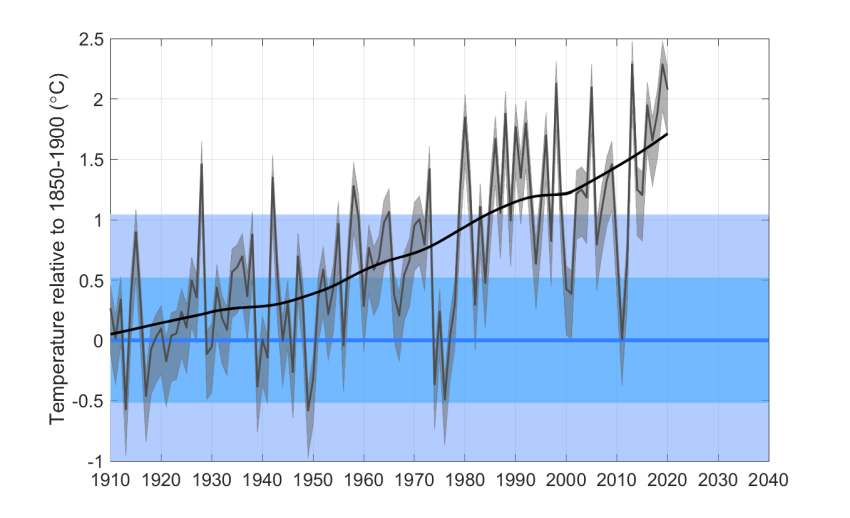
Two standard deviation range separated from pre-industrial range: not yet
Last year possibly within 2 standard deviations of 1850-1900 climate: 2015
South Australia
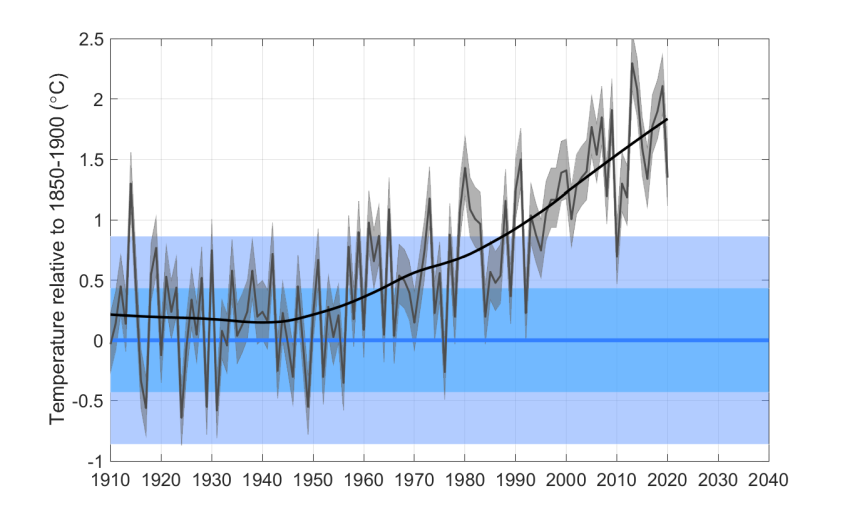
Two standard deviation range separated from pre-industrial range: 2017
Last year possibly within 2 standard deviations of 1850-1900 climate: 2010
Tasmania
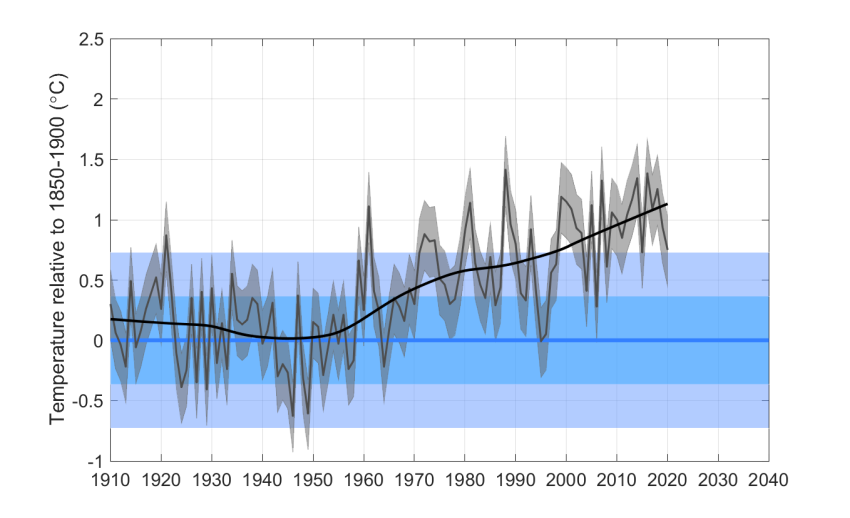
Two standard deviation range separated from pre-industrial range: not yet
Last year possibly within 2 standard deviations of 1850-1900 climate: 2020
Queensland
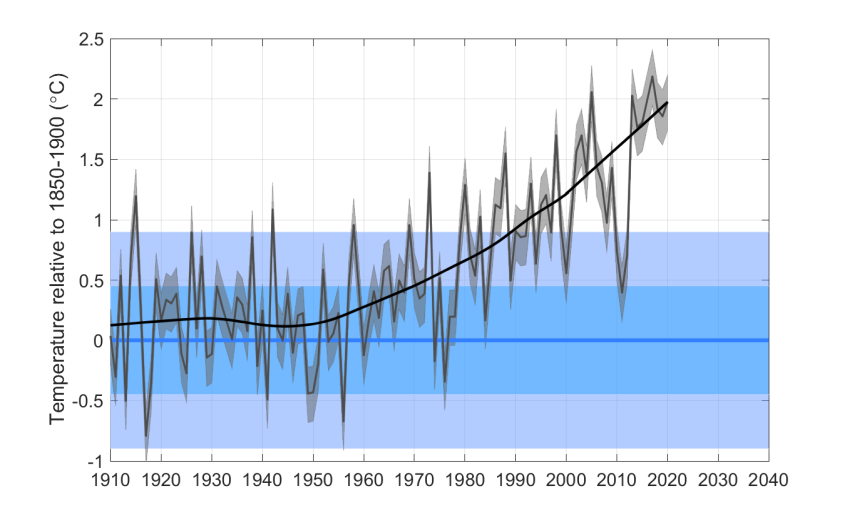
Two standard deviation range separated from pre-industrial range: 2016
Last year possibly within 2 standard deviations of 1850-1900 climate: 2011
Victoria
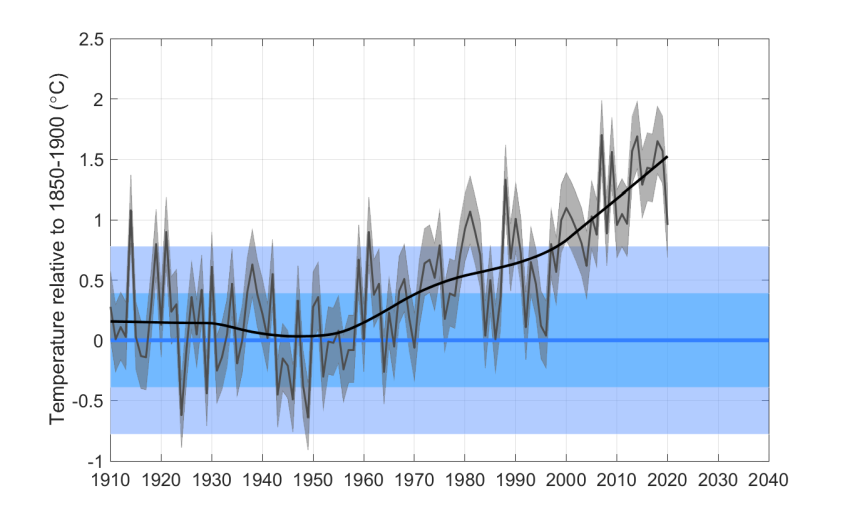
Two standard deviation range separated from pre-industrial range: not yet
Last year possibly within 2 standard deviations of 1850-1900 climate: 2020
Western Australia
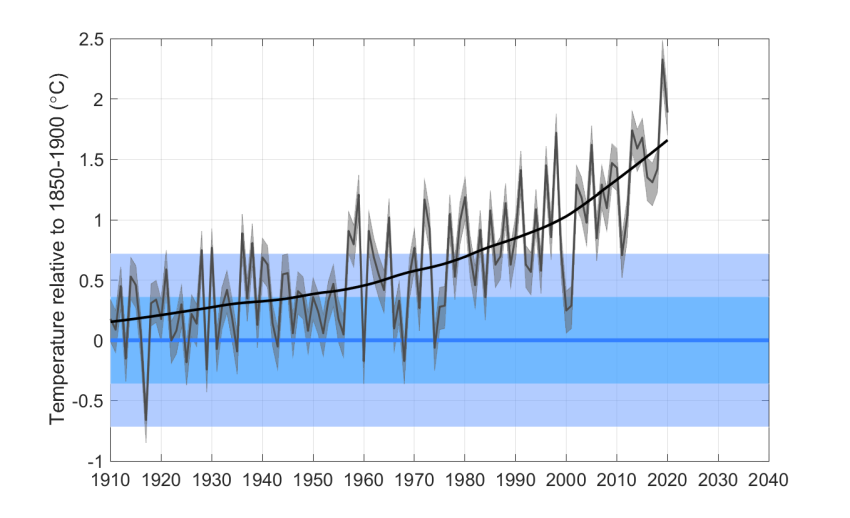
Two standard deviation range separated from pre-industrial range: 2014
Last year possibly within 2 standard deviations of 1850-1900 climate: 2011
Emergence - Super-Clusters
See Super-Clusters for more details.
Eastern Australia
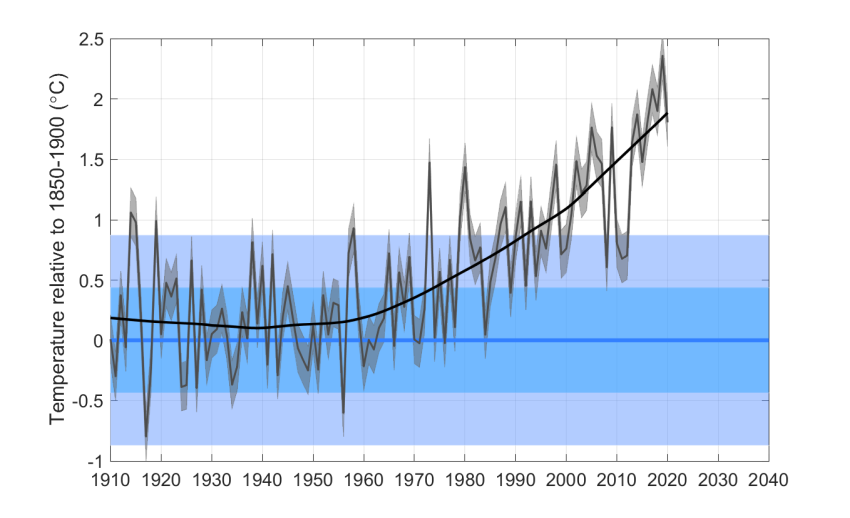
Two standard deviation range separated from pre-industrial range: 2017
Last year possibly within 2 standard deviations of 1850-1900 climate: 2012
Northern Australia
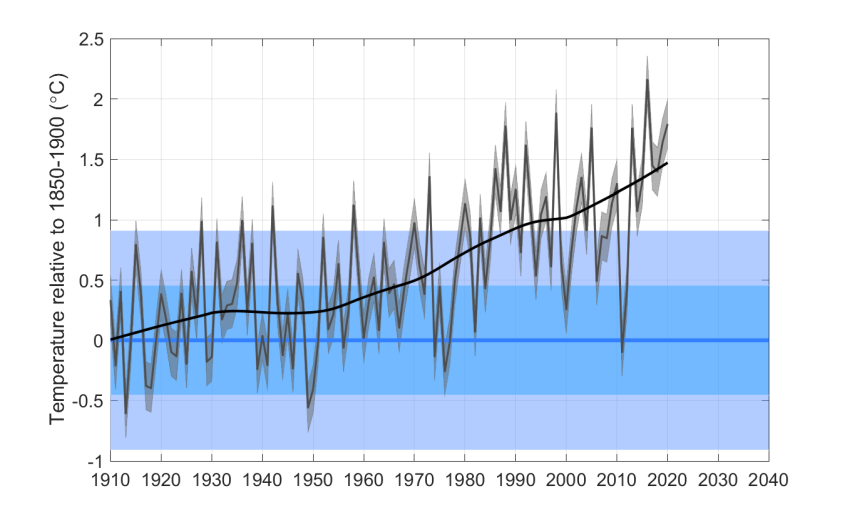
Two standard deviation range separated from pre-industrial range: not yet
Last year possibly within 2 standard deviations of 1850-1900 climate: 2014
Rangelands
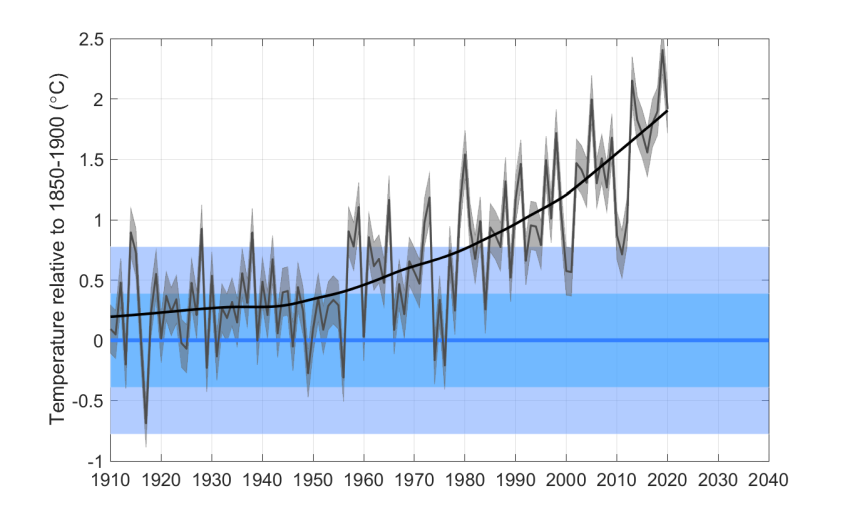
Two standard deviation range separated from pre-industrial range: 2011
Last year possibly within 2 standard deviations of 1850-1900 climate: 2011
Southern Australia
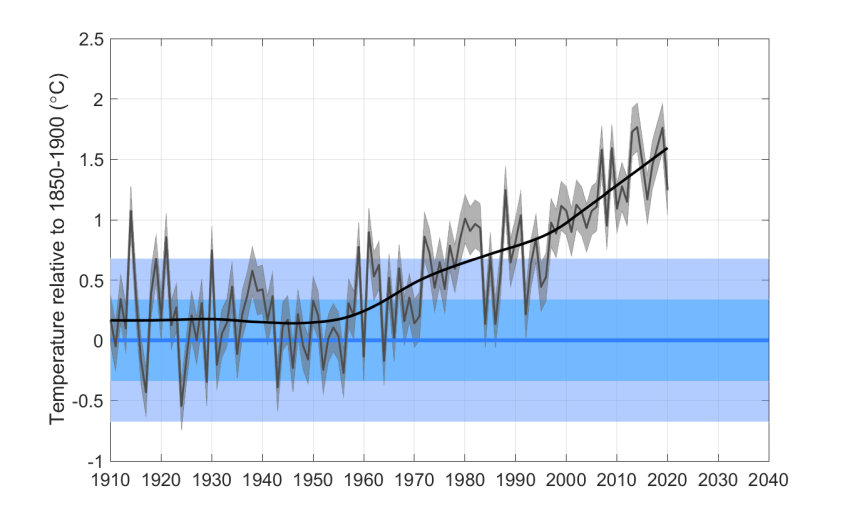
Two standard deviation range separated from pre-industrial range: 2013
Last year possibly within 2 standard deviations of 1850-1900 climate: 1996


