Climate Change in Australia
Climate information, projections, tools and data
Explainer: Internal Consistency
What is internal consistency and why is it important?
Projected changes in climate are often presented as a central tendency (e.g. the mean or median) with a range of uncertainty. For example:
Temperature change of 1.7° (1.1 to 2.6°), or
Rainfall change of -2% (-15 to +13%).
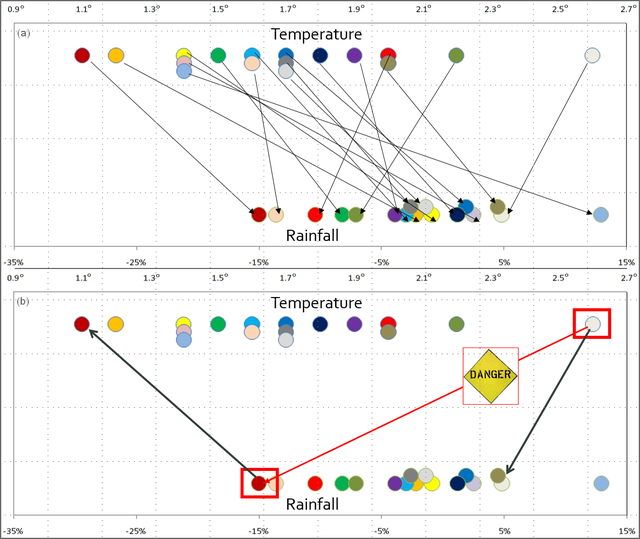
However, detailed impact assessements often require data for multiple variables to be used in combination. For example, you may wish to determine the likely impact of the hottest and driest future. Using the information above, it would be tempting to therefore use a temperature increase of 2.6° (the upper end of the temperature range) in combination with a rainfall decrease of 15% (the lower end of the rainfall range). Figure 1 shows the changes in temperature and rainfall projected by each of 17 climate models. Because the models simulate the climate based on the well established laws of atmospheric physics, the relationships between the two variables are internally consistent. The associated changes from each model are indicated by the arrows in part a (top panel) of the figure.

Internally consistent projected changes in temperature and rainfall from a suite of global climate models. Each model is depicted as a coloured dot. (a) Arrows connect the projected change in temperature and rainfall for each model. (b) shows that the upper temperature and lower rainfall changes from the multi-model ranges are not internally consistent.
Continuing the above example, part b in the figure shows that the combination of variables taken from the multi-model results are not internally consistent.
Therefore, to obtain internally consistent data for use in impact assessments, the projected changes in each variable should be obtained from the same individual climate model. The Climate Futures Framework provides a means of identifying which models to use in a way that adequately captures the full range of the projections.
Page last updated 23rd March 2021


