Climate Change in Australia
Climate information, projections, tools and data
Supporting Information
This interface allows you to explore (and download) the projected changes in eight climate variables for the NRM Clusters and Sub-clusters defined in the Climate Change in Australia Technical and Regional Reports .
The bar-plots show the results from all available (up to 40) global climate model simulations and match those published in the Climate Change in Australia Technical and Regional Reports .
Get Started
1. Click on a region on the map.
2. In the pop-up, select the variable of interest to view the seasonal bar-plot.
3. If you want, download the plot or under-pinning data by clicking on links.
Click on the « symbol in the top-right corner to pop-out the options panel. This allows you to select the map background and regionalisation to use.
Download an image of the bar-plot by left-clicking the image "PNG 1800x900" link. Likewise, download the underlying data (including annual change values) by left-clicking the “csv” link.
If you would rather explore the data from individual models in detail, try the Time Series Explorer and the Map Explorer .
Understanding the Bar-plot

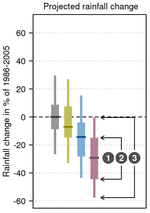
The model data are expressed as anomalies (or differences) from a reference climate (1986-2005). Each bar shows three types of information, as indicated in the figure:
1. The middle (bold) line is the median value of the model simulations (20-year moving average climate); half the model results fall above and half below this line.
2. The bars show the range (10th to 90th percentile) of model simulations of 20-year average climate.
3. Line segments represent the projected range (10th to 90th percentile) of individual years taking into account year-to-year variability in addition to the long-term response (20-year average).
Different RCPs
are shown in different colours: yellow for RCP2.6, blue for RCP4.5 and pink for RCP8.5. Results for four future time periods are shown, grouped by the four standard seasons: summer (Dec to Feb), autumn (Mar to May), winter (Jun to Aug) and spring (Sep to Nov). Note that data for the six-month (northern Australia "wet" and "dry") seasons can be displayed and downloaded from the Map Explorer
and Climate Futures
tools.
Note: all links on this page open in a new window or tab (depending on your browser settings).
Page update: 22nd October 2019


