Climate Change in Australia
Climate information, projections, tools and data
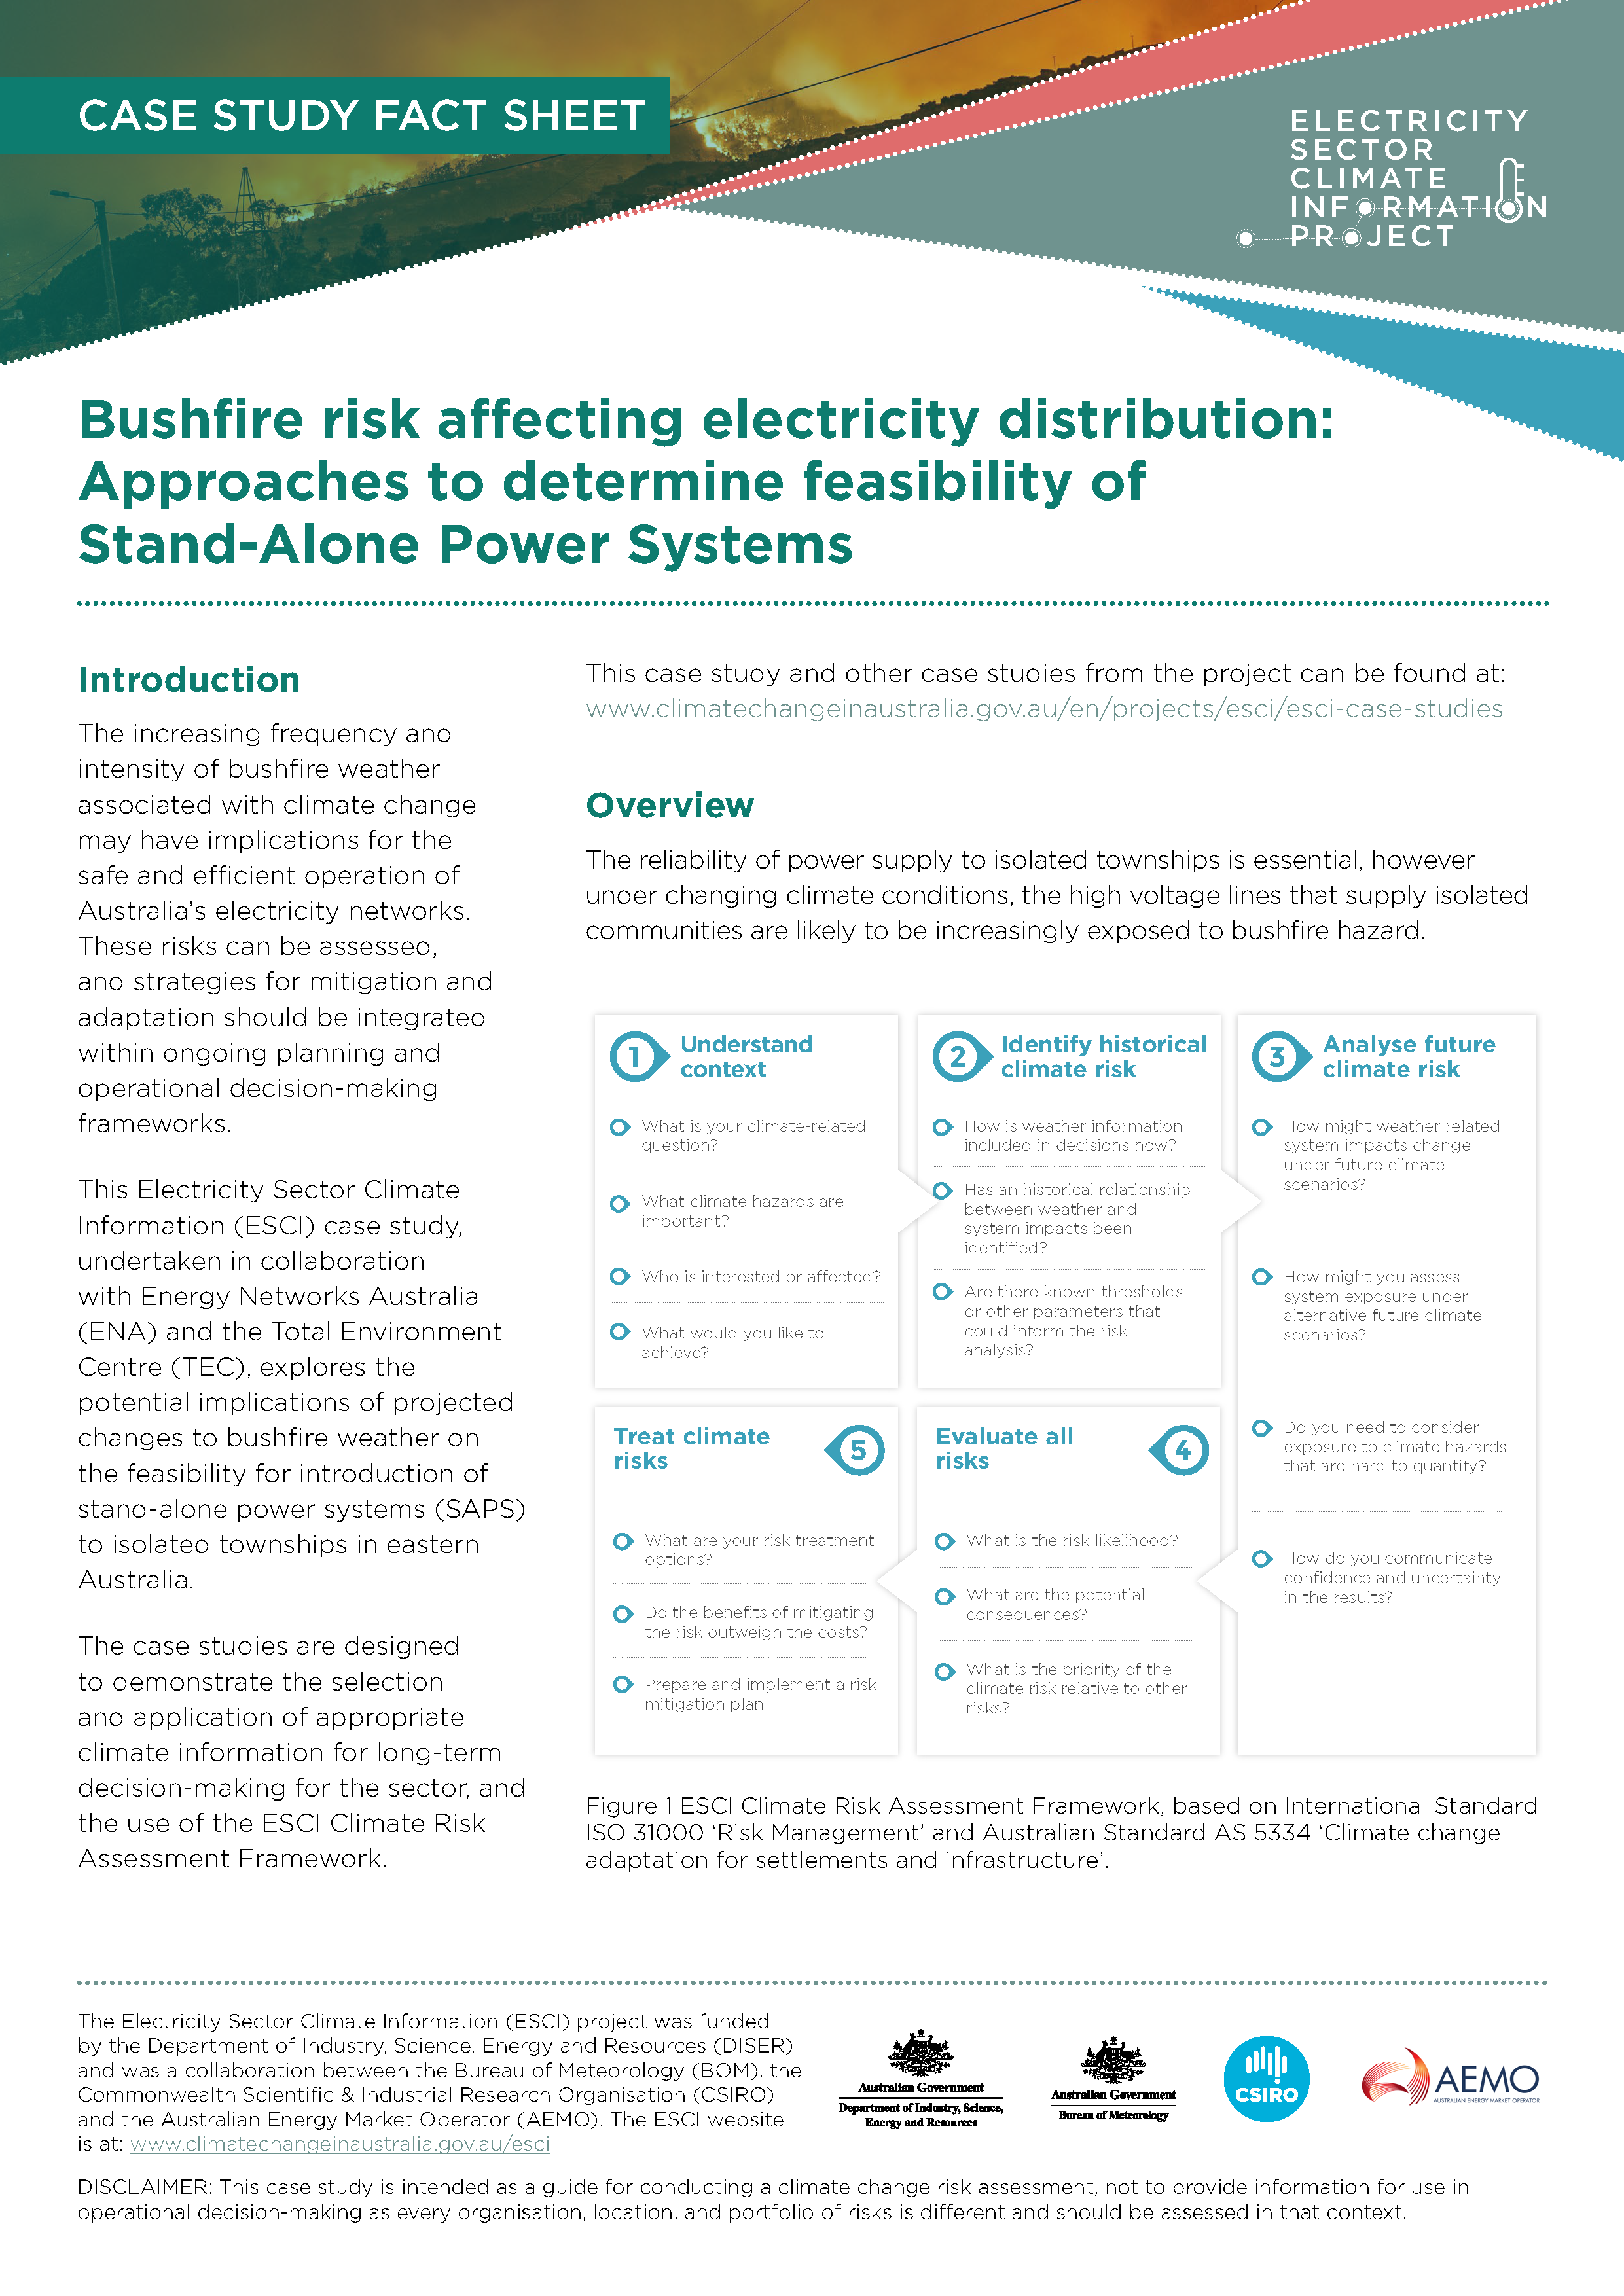
Case Study: Bushfire & Distribution
Full Case Study
(pdf 1.4 MB)
- Why Was This Case Study Chosen?
- How Did the Case Study Use Climate Data?
- What Did We Find?
- What Similar Problems Could This be Applied to?
- Downloads
Why was this case study chosen?
Bushfires have adversely affected the reliability of the community’s electricity supply on many occasions in Australia. During 2019–2020, for example, bushfires resulted in over 280,000 customers losing power for periods ranging from 1 to 10 days (Royal Commission in National Natural Disaster Arrangements 2020, p 229). More isolated communities, located at the end of single high voltage distribution lines, are particularly vulnerable. In general, the longer the distribution line, the higher the risk of bushfire damage, and the higher the chance of being disconnected from electricity supply due to bushfire events (depending also on the presence of bushfire-prone vegetation).
This ESCI case study, undertaken in collaboration with Energy Networks Australia (ENA) and the Total Environment Centre (TEC), explores the potential implications of projected changes to bushfire weather with climate change, which may contribute to the business case for potential mitigation options such as the feasibility of the introduction of stand-alone power systems (SAPS) for isolated townships in eastern Australia.
How did the case study use climate data?
Six sites in eastern Australia were identified where single, relatively long distribution lines pass through forested areas to isolated towns. For these sites, projected changes in frequency and duration of bushfire weather risk were assessed using the Forest Fire Danger Index (FFDI) metric, a measure of 'bushfire weather'.1
Time-series of daily FFDI were accessed from four climate models to represent the range of projected change. From these data sets, changes in frequency of days with very high fire risk (FFDI > 25) for future periods can be compared to the present. Similarly, duration of the fire season (defined here as the number of days from the first day with FFDI > 25 to the last day with FFDI > 25 each year) is also explored.
What Did We Find?
For the 2040–2059 period, the ‘worst case’ model (under high emissions, RCP8.5) indicates a possible doubling of bushfire weather frequency at all sites except for Strahan in Tasmania (Figure 1, left-hand plots). For the 2060–2079 period, the ‘worst case’ model (under high emissions, RCP8.5) indicates increases of around 150% at all sites except Strahan, while the ‘best case’ indicates a mixture of moderate increases and decreases.2
For all sites, the ‘worst case’ scenario results in a large increase in fire season duration, for example Coonabarabran may see more than doubling of the fire season duration under the high emissions scenario explored in this case study. The mean value across the four models (indicated by ‘X’) also increases. However, the ‘best case’ scenario at Coonabarabran, for example, indicates a slight decrease in duration by the end of the century (Figure 1, right-hand plots).
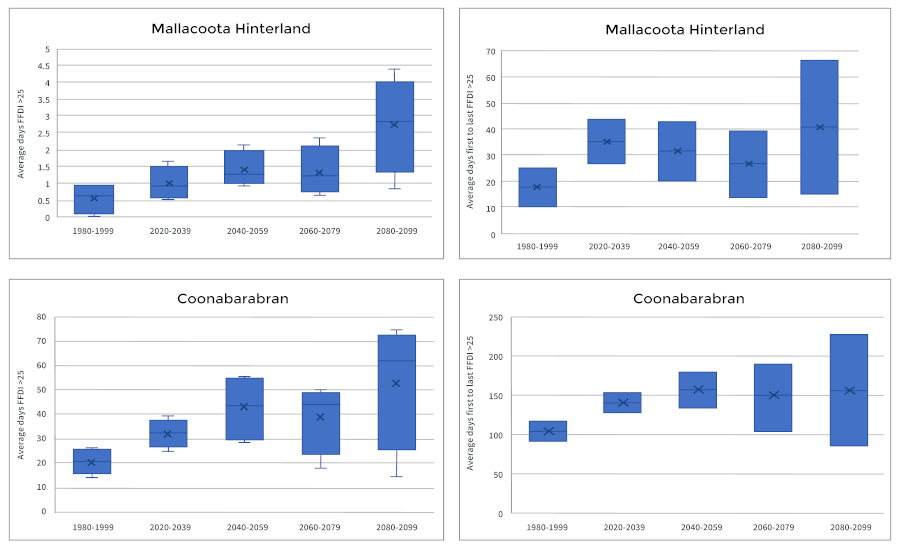
Figure 1 Historical and future annual average number of days with FFDI > 25 (left), and fire season duration (average number of days from first to last FFDI > 25 in the period 1 July to 30 June) (right) for Mallacoota hinterland (top) and Coonabarabran (bottom). Both analyses use five 20-year time periods, for four models simulated under RCP8.5. Blue box indicates 25th to 75th percentile of the model range, with the mean indicated by ‘X’. See attached ESCI case study—bushfire & distribution—for details of the analysis. Note: vertical axis scales are different for the different locations.
What similar problems could this be applied to?
Distribution network service providers need to assess the future risk of bushfires in order to determine whether to change line maintenance practices, replace damaged assets with like for like, or build back better or differently after a bushfire event to ensure that customers have a resilient electricity supply. Options include reducing the number of powerlines or taking communities off the grid, either permanently, or in a way that allows a community to be ‘islanded’ (independent of the electricity network) when required, using SAPS.
Changes in bushfire risk are also of interest to transmission network service providers. Where transmission lines, or proposed routes, go through remote or heavily forested areas, and bushfire risk is increasing significantly, changes in maintenance practices, or even changing proposed routes, could be cost-effective.3
The annual number of extreme fire weather days is projected with medium-to-high confidence to increase in all parts of Australia and for all climate scenarios.4 Maps can be found on the ESCI website describing future bushfire weather scenarios and how these vary regionally according to a range of climate models. The rate of projected FFDI increase at locations of interest to the electricity sector can be explored using time series, also found on the website.
For more detail on this assessment please see the full Case Study report (pdf 1.4 MB)
The ESCI User Guidance explains how to conduct your own risk assessment.
Notes
1 Note: FFDI includes measures of dryness—based on rainfall and evaporation—wind speed, temperature and humidity but does not include the contribution to bushfire risk from fuel types, ignition, such as lightning, or fuel management practices.
2 See Technical report on this case study for more detail.
3 See ESCI Case Study—Bushfire & transmission .
4 See ESCI Key Concepts —Climate projection confidence & uncertainty.
Downloads
DownloadFull case study report and all figures (zip 1.3 MB)