Climate Change in Australia
Climate information, projections, tools and data
Case Study: Bushfire & Transmission
DownloadFull Case Study
(pdf 3.6 MB)
- Why Was This Case Study Chosen?
- How Did the Case Study Use Climate Data?
- What Did We Find?
- What Similar Problems Could This be Applied to?
- Downloads
Why was this case study chosen?
The national electricity market (NEM) operates on one of the world’s longest interconnected electricity systems. Its transmission and distribution networks are often exposed to bushfires which can cause direct physical damage to transmission lines, or, more frequently, can cause pre-emptive derating or disconnection of supply to avoid the risk of phase-to-phase arcing caused by heat and smoke from nearby bushfires.
When designing new transmission lines, designers consider paths that diversify the risk associated with bushfires by building geographically diverse line paths, aiming to minimise the probability of losing multiple transmission lines to the same event. (They also minimise the exposure to bushfires by avoiding vegetated areas where possible.) Understanding the how bushfire weather is likely to change in the future, and how this varies regionally, may help with the assessment of the best path for transmission lines. If future bushfire risk is lower along a potential path, this could improve its investment case.
How did the case study use climate data?
The case study assessed historic and future time-series of Forest Fire Danger Index (FFDI) extracted for various locations. Data from 21 climate model simulations were assessed and the ensemble range of results are presented for this case study.
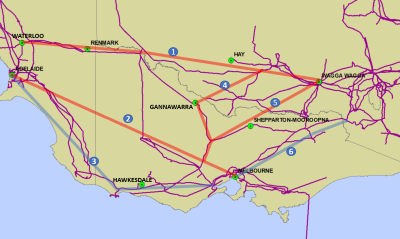
Existing lines in Victoria, eastern South Australia and southern New South Wales are represented by routes 3 and 6. Two new potential transmission line paths being considered are indicated by paths 1 and 2 (Project Energy Connect ) and line paths 4 and 5 (Figure 1).

Figure 1 Paths for proposed transmission lines (red) for Project Energy Connect (1 & 2) and Victoria–NSW interconnector (4 & 5), and existing paths indicated in blue (3 & 6) superimposed over transmission line network (purple lines). Identified locations of case study analyses for changes in FFDI (green circle).
What Did We Find?
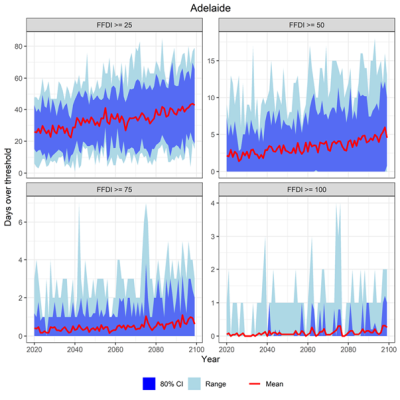
Projections of the number of days above defined FFDI thresholds (FFDI > 25, FFDI > 50, FFDI > 75, FFDI > 100) were calculated for locations along the different transmission paths. Figure 2 shows a time-series analysis for Adelaide (as an example).

Figure 2 Time-series of projected FFDI (Sept to April period) for Adelaide for 4 different thresholds, corresponding approximately to 'very high' (FFDI >=25), 'severe' (FFDI >=50), 'extreme' (FFDI >=75) and 'catastrophic'(FFDI>=100) bushfire risk. The analysis shows data for RCP8.5 based on an ensemble of 21 Global Climate Models using CCAM and QME downscaling scaling. The red line denotes the mean of the ensemble, the dark blue band shows values corresponding to the 10th to 90th percentiles.
This analysis showed that bushfire weather varies across the landscape, with inland locations (such as Hay, Gannawarra and Renmark1 experiencing more frequent bushfire weather than coastal locations. For all FFDI values and all locations the frequency of extreme fire weather days increased. There is also an increase in the more extreme FFDI indices through the assessment period. The rate of change of bushfire weather was observed to be broadly consistent between the paths.
What similar problems could this be applied to?
The FFDI index combines a record of dryness, based on rainfall and evaporation, with meteorological variables for wind speed, temperature and humidity, although it does not include other important factors such as fuel load and ignition. Although bushfire weather is only one factor in bushfire risk, bushfire weather trends can provide useful information for long-term planning for bushfire risk treatment. This could include:
Long-term planning of paths or equipment: Information on the spatial distribution of bushfire weather may help with planning for the location of key infrastructure sites such as terminal stations.
Fuel load management: Understanding how bushfire weather is changing can inform long-term fuel-management planning to help increase reliability. Increasing severity of bushfire weather conditions could increase the cost of fire management practices along some lines.
Impact, cost and consequence calculations: Fire weather from the ESCI project can be integrated into industry models such as PHOENIX RapidFire, a model that simulates bushfire behaviour, SPARK, which simulates bushfire behaviour, or Project Ignius, which seeks to develop a standardised methodology to assess the cost of a major bushfire event.
Maps of changes in FFDI and time series of FFDI projections for multiple climate models and 168 locations around the NEM are accessible via the ESCI portal. The website also provides more general information on how to conduct a climate risk analysis and access to additional support materials.
The ESCI team would like to thank members of ElectraNet and the Bushfire and Natural Hazards CRC who contributed to this case study.
For more detail on this assessment please see the full Case Study report (pdf 3.6 MB) .
The ESCI User Guidance explains how to conduct your own risk assessment.
Notes
1 See more detailed Technical Report.
Downloads
DownloadFull case study report and all figures (zip 3.4 MB)


