Climate Change in Australia
Climate information, projections, tools and data
Case Study: Wind & Transmission
DownloadFull Case Study
(pdf 1.4 MB)
- Why Was This Case Study Chosen?
- How Did the Case Study Use Climate Data?
- What Did We Find?
- What Similar Problems Could This be Applied to?
- References
- Downloads
Why was this case study chosen?
Severe wind events, often associated with severe thunderstorms, can cause transmission towers to fail affecting the reliability of electricity supply to customers.
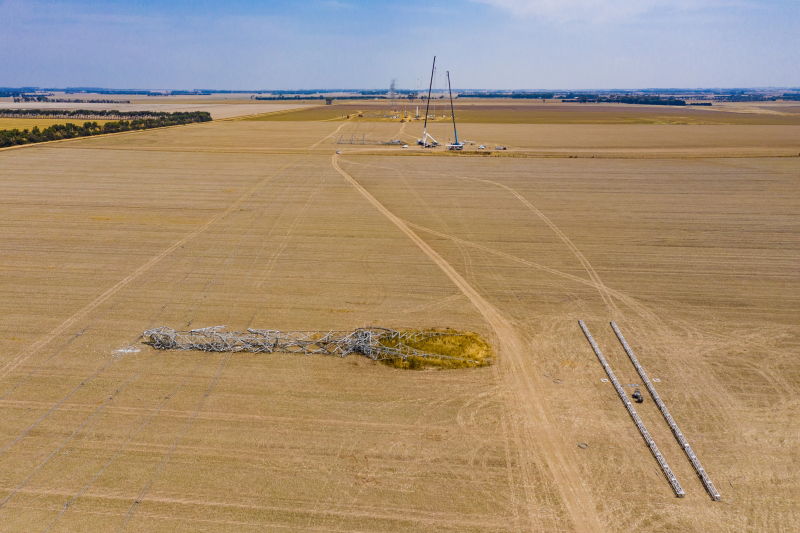
A recent example of one of these types of events (January 2020) occurred in south-western Victoria, where downbursts associated with a severe thunderstorm resulted in severe damage to transmission lines with six 500 kV transmission towers destroyed (Figure 1).1 This case study sought to better understand downbursts and whether that hazard is likely to be influenced by climate change.

Figure 1. Damage to the Mortlake to Moorabool to Heywood interconnector from the 31 January 2020 event. (Source: AusNet)
How did the case study use climate data?
Severe convective wind gusts (SCWs) that cause transmission tower failure are well below the resolution of global climate models. Therefore, the ESCI team developed a diagnostic which can relate the large-scale environmental conditions simulated by climate models to SCW occurrence (Brown and Dowdy 2021). The new diagnostic can provide information on current SCW risk from climate model data with greater consistency than existing methods for Australia. This method has not yet been applied to climate models to provide future projections.
What Did We Find?
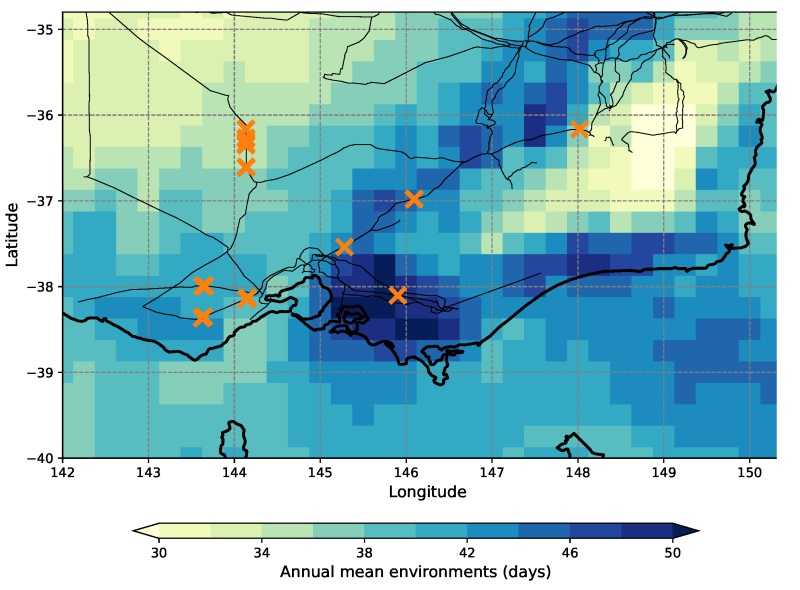
Annual mean historical environmental frequency of conditions conducive for SCWs (greater than 25 ms-1) averaged over a 40-year period (1979–2018) are plotted, along with sites corresponding to 11 historical AusNet tower failure events (Figure 2). The analysis demonstrates that most of the time, the catastrophic tower failures occur in regions where favourable downburst environments occur relatively frequently, as indicated by the statistical diagnostic over the historical period. The statistical diagnostic also indicates significant correlation with tower failures based on a time-series for each event.2 This case study has established the usefulness of the new environmental approach as an indicator of the regional variation of the number of days per year where SCWs may occur.

Figure 2. The SCW indicator showing annual mean historical environmental frequency of conditions conducive for SCWs greater than 25 ms-1 (averaged over the period 1979-2018) compared with 11 events, from 1959–2020 (orange ‘X’). (Source: BoM analysis (Hersbach et al. 2020) and AusNet Services data)
Analysis of 40 years (1979–2018) of data across the NEM suggests no significant trend during summer for the frequency of days indicated by the SCW diagnostic, with potential regions of decreased risk indicated for some inland locations3 (trends differ for other seasons).
Although this study uses the best available information on SCWs in a changing climate over recent decades, considerable uncertainties remain, and important factors are not included in the diagnostic method (such as mechanisms that initiate thunderstorm formation, which may also change in a changing climate). It is intended that this diagnostic will be applied to climate model projections to provide an assessment of possible future changes.
What similar problems could this be applied to?
All transmission networks in the national electricity market (NEM) suffer damage from severe convective winds, so while the focus of the statistical diagnostic for this case study was on the AusNet transmission system in Victoria, the new diagnostic can be used to consider current and future risk over the whole NEM.
Maps of wind hazard for all states are available on the ESCI website.
The ESCI User Guidance explains how to conduct your own risk assessment.
For more detail on this assessment please see the full Case Study report (pdf 1.4 MB) .
References
Brown A and Dowdy A (2021). Severe convection-related winds in Australia and their associated environments. Journal of Southern Hemisphere Earth Systems Science 71:30–52. https://doi.org/10.1071/ES19052
Hersbach H, et al. (2020), The ERA5 global reanalysis. Quarterly Journal of the Royal Meteorological Society 146(730):1999–2049. https://doi.org/10.1002/qj.3803
Notes

1 Major power outages were avoided in this event and the towers have now been rebuilt.
2 See more detailed Technical Report on this case study.
3 See ESCI Technical report on the Standardised Methodology for Projections Likelihood.
Downloads
DownloadFull case study report and all figures (zip 1.2 MB)


