Climate Change in Australia
Climate information, projections, tools and data
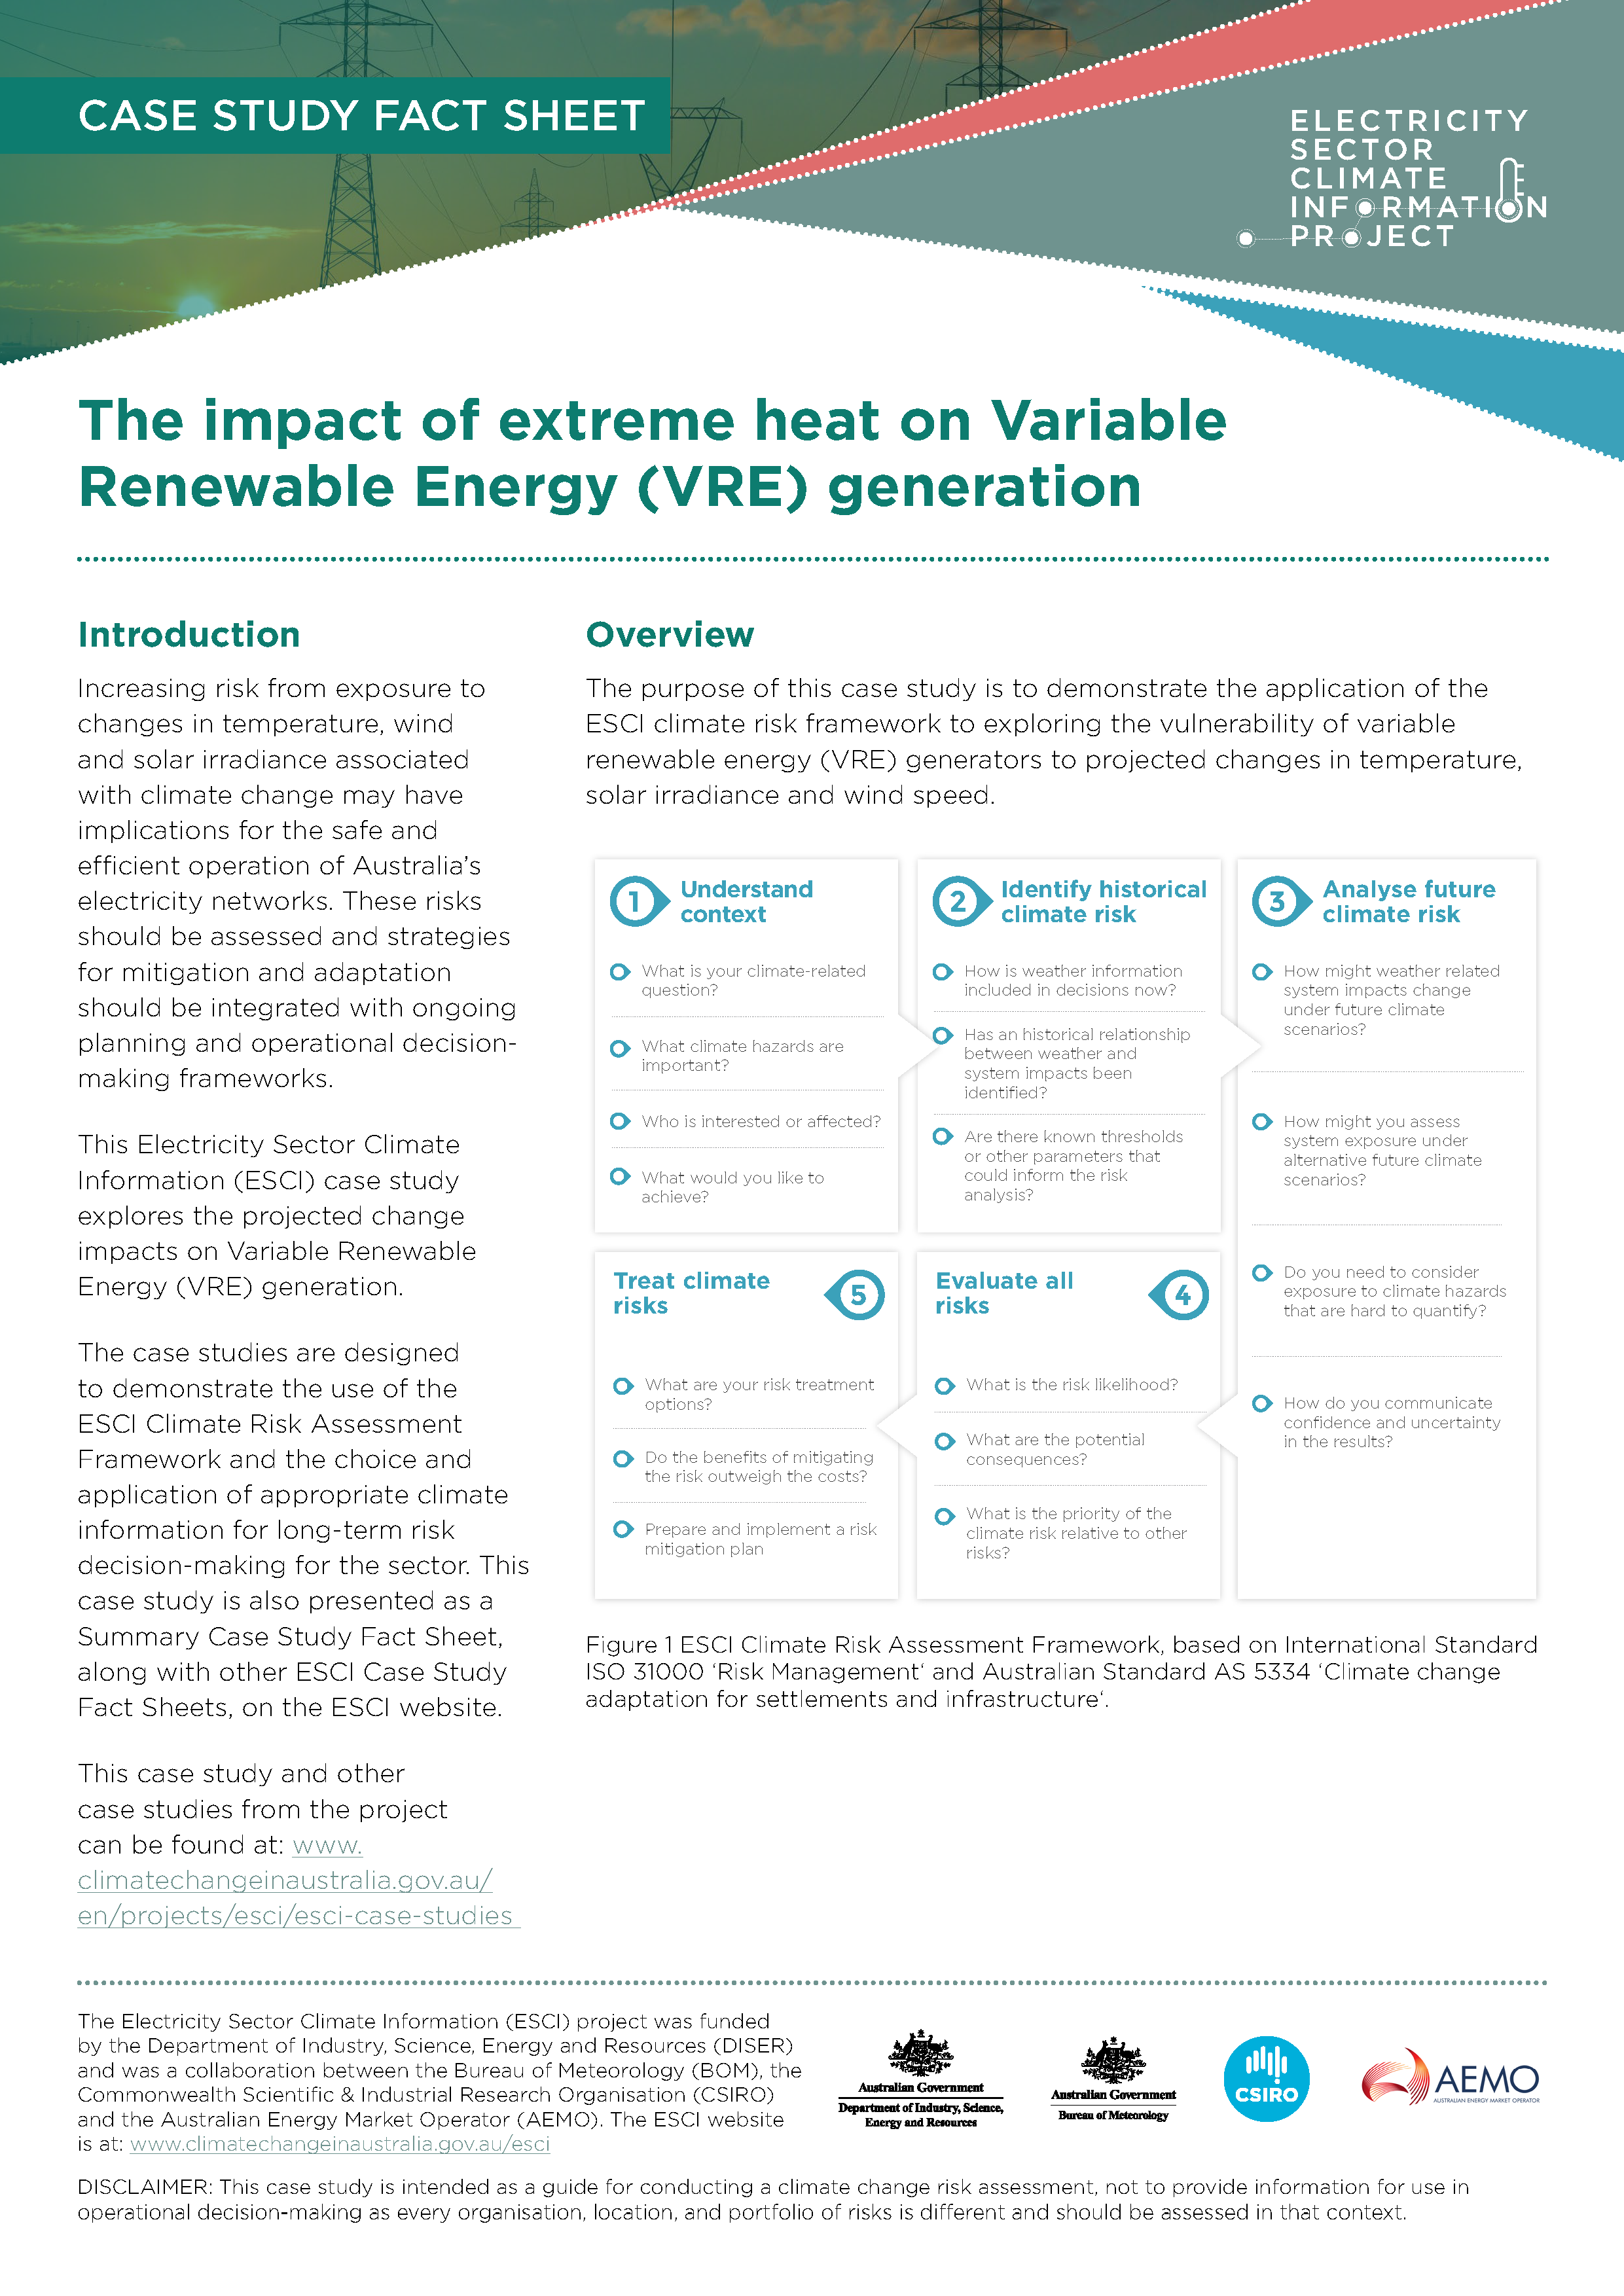
Case Study: Extreme Heat & Variable Renewable Energy (VRE)
Full Case Study
(pdf 813.9 KB)
- Why Was This Case Study Chosen?
- How Did the Case Study Use Climate Data?
- What Did We Find?
- What Similar Problems Could This be Applied to?
- References
- Downloads
Why was this case study chosen?
VRE generation sources driven by wind and solar energy are making an increasing contribution to the supply of electricity in the National Electricity Market (NEM). The electrical and mechanical power system components of solar and wind farms are vulnerable to extreme heat, with potential disruption to generator output and system reliability. Extreme heat is also a major driver of customer demand, and outages during high demand periods leave consumers vulnerable and can incur large societal impacts.
How did the case study use climate data?
For this case study, a solar farm model1 and a wind farm ‘power conversion model’ were used to understand how normalised AC power output varies with temperature, Global Horizontal Irradiance (GHI), Direct Normal Irradiance (DNI), and wind speed at 10 m.
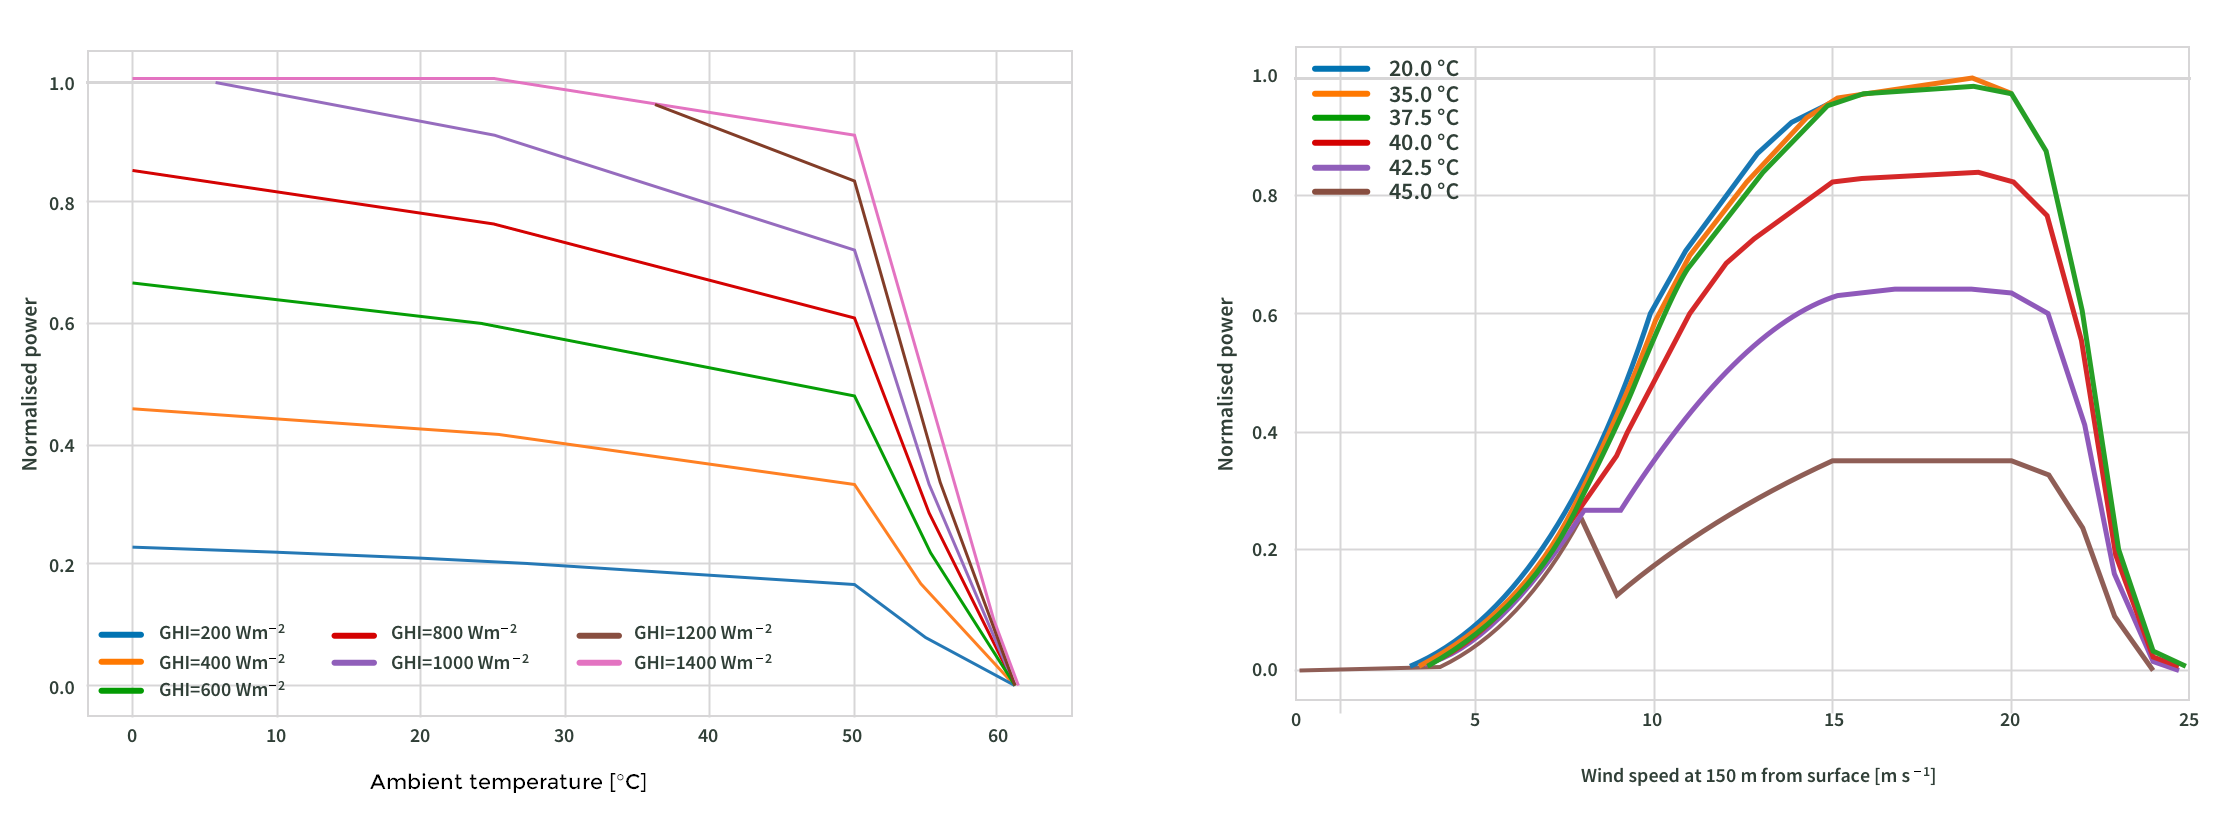
Figure 1. Indicative power conversion models used in this case study. Solar farm output (left) as it varies with temperature as a function of Global Horizontal Irradiance (GHI). The wind farm model (right) describes normalized AC power output varying with wind speed (150 m from surface; ms-1) across different temperatures.
The normalised power output for solar depends on both the level of solar input, indicated by the different levels of GHI in the modes, and temperature, with power output declining slightly with increasing temperature up to about 50 °C, and then falling rapidly (Figure 1, left). Wind farm output depends on both wind speed (noting that at high wind speeds the power output declines sharply) and temperature (Figure 1, right), power output increases with windspeed up to 20 ms-1, but declines significantly with temperature with power output falling to about a third of maximum for temperatures over about 45 oC.
The case study team analysed time series of the mean annual values for variables of interest at four Renewable Energy Zones (REZ) from 2020 to 2060 (given the lifetime of solar and wind farm components is about 25 years). Projections of both daily and 30-minute simulations of ‘future weather’ are drawn from a range of six models used to represent the plausible range of future climate. By assessing generator output at this high temporal resolution, the risks can be assessed at relevant time intervals.
WHAT DID WE FIND?
Changes in temperature, wind and solar irradiance were found not to affect average annual normalised solar or wind farm output,2 however, simulations of wind farm impact on one of the hottest days in the sample at Western Victoria indicates mean output during the peak demand period (12pm to 7pm) can reduce to zero (e.g. Figure 2). Therefore, it was of interest to understand the impact of projected changes in temperature, wind and solar irradiance during periods such as these when reliability could be affected by decreased supply.
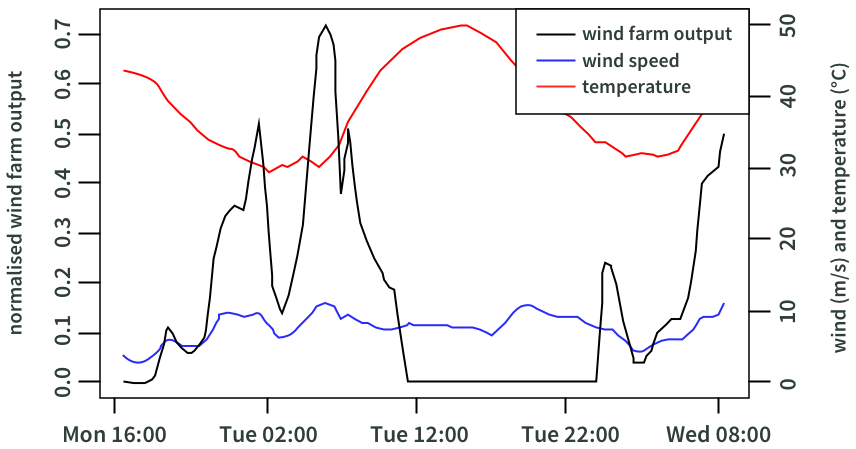
Figure 2 Thirty-minute simulation of wind farm output (black line) for varying temperature (red line) and wind speed (blue line) in western Victoria.
To assess the impact on VRE output during peak demand, the 30-minute modelling was filtered to analyse the impacts on solar and wind farm output (Figure 3). For this study, peak demand periods were defined as the top five hottest days per year between 12pm and 7pm AEST, a time period likely to capture the timing of daily maximum temperature and the timing of maximum electricity demand.
For the peak demand period, solar de-rating was relatively limited for the four case study locations. Wind power generation had greater output reductions under projected temperature increases for the same locations. While the GCMs show high levels of expected year to year variability, there are high levels of agreement regarding the trend, with steepest trends in the regions with the hottest maximum temperatures.
While long term solar output may increase in some locations due to possible increases in irradiance wind farm output during peak demand periods may fall, even if average outputs remain unchanged.
The impact on variable renewable energy could be mitigated by:
- increasing the robustness of VRE design specifications to heat
- including on-site energy storage to support VRE output intermittency
- procuring additional dispatchable capacity, or demand side participation to make the system more robust
What similar problems could this be applied to?
This risk assessment is relevant for renewable energy investors and operators as high temperatures tend to correspond to high wholesale price periods.
Extreme temperatures are a system-wide problem for the electricity sector as demand is correlated with temperature. In addition, transmission and distribution lines can’t carry as much power when the ambient temperature is high. 3 Therefore, this kind of risk assessment can be useful for many assets or system decisions.
Scientists have high confidence in the likelihood of temperatures increasing with climate change. Maps of ARI for temperatures and time series projections of multiple variables are available on the ESCI website. The ESCI User Guide explains how to conduct your own risk assessment.
For more detail on this assessment please see the full Case Study report (pdf 814 kB) .
References
Dobos AP (2014). PVWatts Version 5 Manual. NREL Technical Report. (PDF )
Holmgren WF, Hansen CW, and Mikofski MA (2018). pvlib python: a python package for modeling solar energy systems. Journal of Open Source Software. https://doi.org/10.21105/joss.00884
NOTES
1 Developed in the PVLIB (Holmgren et al. 2018) and PVWatts (Dobos 2014) models assuming a single axis tracking installation using SMA Sunny Central 850CP XT inverter and a DC-to-AC ratio of 1:2.
2 This analysis is described in detail in the Technical Report for this case study.
3 See ESCI case study—Extreme heat & transmission.
Downloads
DownloadFull case study report and all figures (zip 811.2 KB)